
If you read any of the major news websites (msn, fox, yahoo) you will certainly see that the stock market has seen a decent dip today based on the home sales data released from the National Association of Realtors (NAR) for August.
The report shows a decrease in existing sales of 1.8% for the month. Although the media likes to sensational any tidbit of information to get people to click on their stories. The slowdown is somewhat expected. Let me tell you why.
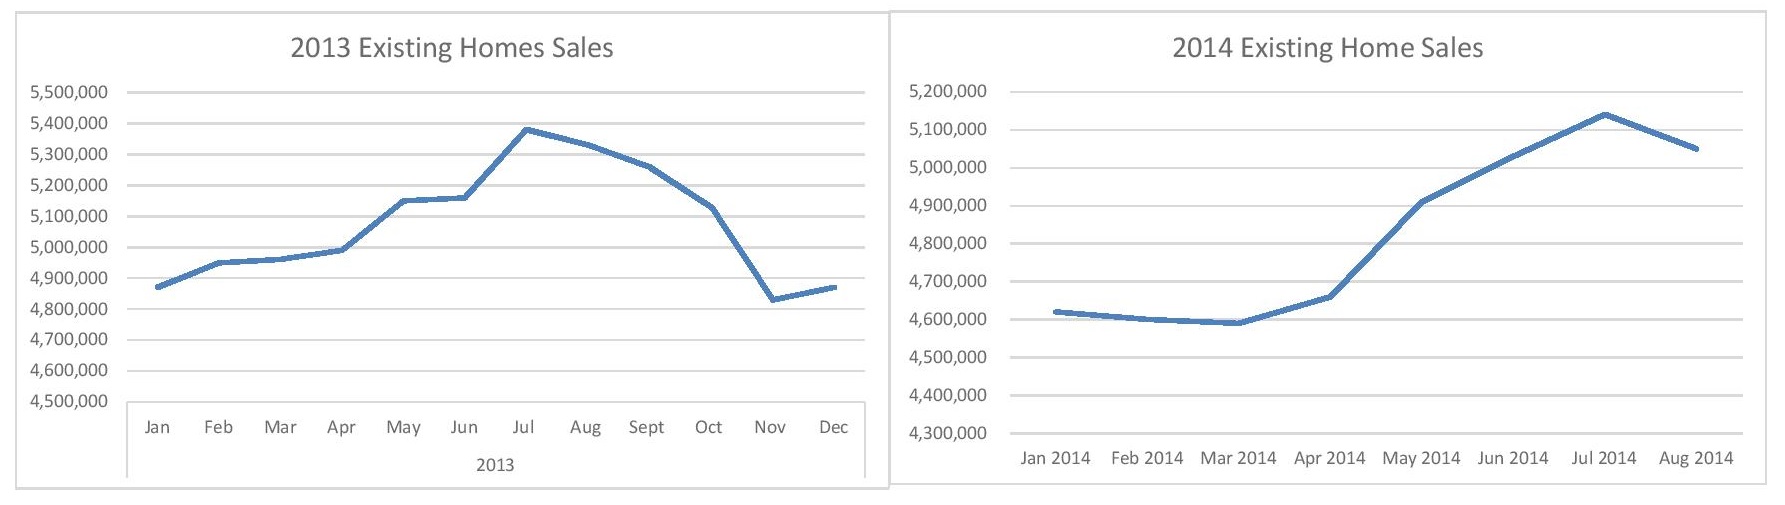
If you look at a normal sales cycle of existing homes throughout the year the selling season is typically thought of to start the weekend after the Super bowl and winding down on Labor Day (Feb through Aug). It has an upswing starting in spring peaking in the start of the summer and then winds down to finish out the year on a slide. As you can see in the charts below:
If we take a more macro view of the housing market, say in the last 10 years. We have been in an atypical real estate market for almost the entire time. So making an assumptions based on any of this data is somewhat flawed because it doesn’t have enough consistent samples, especially making bold headline worthy statements from a month to month change in the sales volume.
What I mean by an atypical market is: that is in 2004 through 2007 we had a frenzy of activity and run up on pricing and volume of sales which was stimulated by sub-prime borrowing (free money). We then had the bubble bursting crash resulting in a drastic cliff like fall off in volume and pricing in 2007 and 2008. In 2009 we went to a dead nothing happening market (housing had flat lined). To 2010 and 2011 activity was sporadic in volume and in specific areas, given that the sales were mostly driven by early investors looking to buy assets at well below market pricing. Finally by 2012 we started to get back to a little bit of a normal cycle, as lending standards had loosened, and buyers felt like the housing had stabilized plus we had people that went through foreclosure now re-entering the market. But really 2013 and now 2014 are more of what would be considered something of a normal sale cycle.
Days on Market (DOM)
In addition to getting back to what a normal sale cycle looks like we have also seen more traditionally normal market times. If we look at DOM in the post housing bubble time of 2010-2012 we saw the inventory vastly distressed and at substantial discounts. Especially in areas hit hardest by foreclosures (CA , NV and AZ). Which resulted in mostly investor’s and cash buyers gobbling up inventory at insane rates. At one point we had less than a month inventory on the market in parts of California. This led to bidding wars and almost non-existent DOM times. Now that we are in these more normal sell cycles of 2013 and 2014 we are seeing a regression to the mean on DOM times. Which is ranging between 30-60 days before a house will go into contract.
All of these trends are actually normal in variety and by no means headline worthy. However I don’t think that is going to stop anymore from writing about them like they might be.
The one thing to note about the data was the continued decrease in distressed sales (Foreclosures, Short Sales). As well as a continued increase of equity sales (Homeowners). This shows signs that more investors are existing the market as the majority of the low hanging fruit has been picked and the homeowners are starting to pick up the slack as the prices have increased to relieve some of the homeowners that were upside down.
God Bless
- Jake