Stocks, Oil Prices and Real Estate by Jake Harris

The question I am asked several times a week is where do you put your money now?

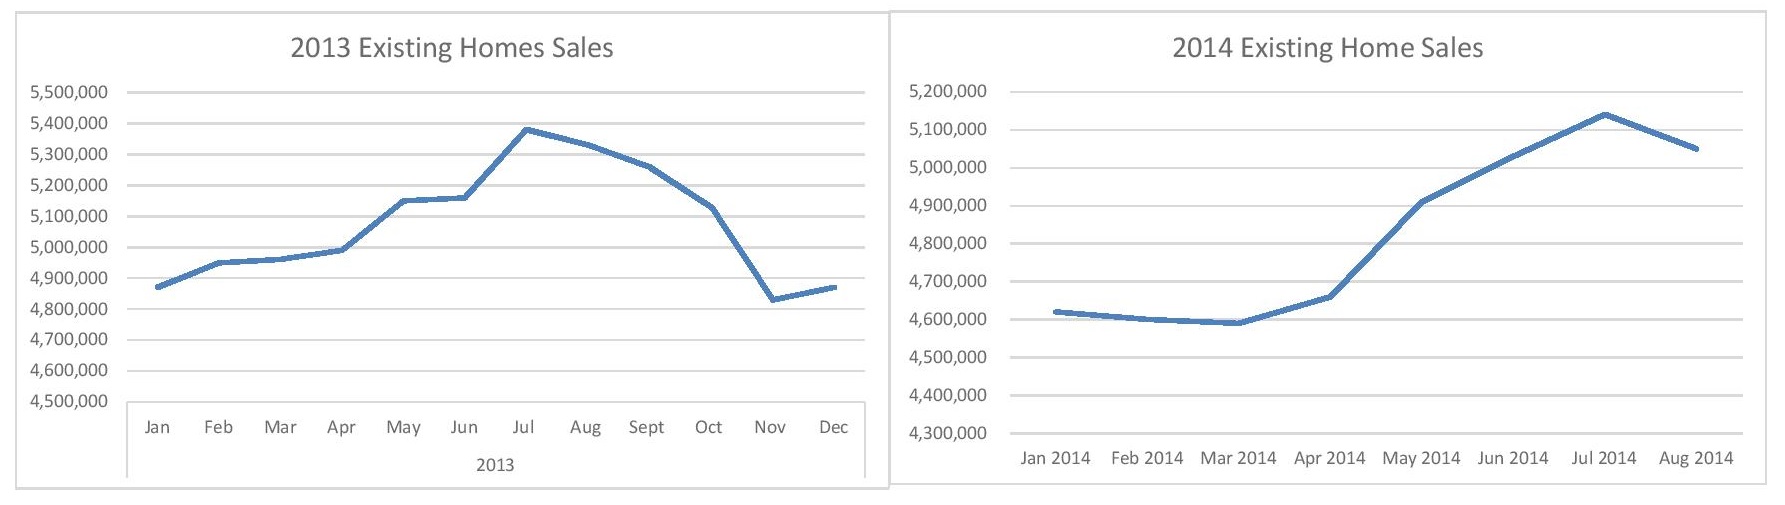
In the last several years, we have seen the stock market make record gains and at record highs, as well as the real estate market experienced massive amounts of distress but plenty of opportunity.

What do we do now? For the vast portion of people I have talked to the fear of the unknown has caused them to just stock pile cash in the bank and do nothing with it. This is essentially losing money if you factor in the nothing interest rates and inflation.

The question remains where do you put your money now? For me I feel there is a stock market correction coming down the pipeline. I am thinking with a stock market correction investors will take their last 3-4 years profits off the table and look to greener pastures. I am sure there is particular stocks and segments that will be just fine but stocks are not my cup of tea so I look to real estate. I feel a lot of the low hanging fruit has already been picked through (California, Vegas, Phoenix, Florida). As investors look for new places to place their money I feel real estate is the next logical choice as it is still down in parts of the country, that have good fundamental growth and affordability.

So for me the question is where is that place that has good affordability, good fundamental growth and enough inventory to support investor activity.

Also with the recent oil prices falling nearly in half since last June it is worth watching as this has both good and bad effects on particular markets. That either benefit for low cost of fuel, transportation, manufacturing or travel. Or the flip side of the coin those that depend on mineral rights, high cost oil wells like fracking that could be forced to close down and lay off workers.

- God Bless

Jake Harris

Supply and Demand: YEE-HAW style by Jake Harris

Supply and demand is in my opinion the single largest factor in determining real estate values. I know we could get into affordability, interest rates and jobs. I think those are all important but the single largest factor to me is: supply and demand (people want more properties than are available, prices go up and not enough demand for properties prices go down)

There are different forms of supply and demand in the market today. The reality is that over the last 4 to 5 years we have seen a substantial amount of distress in the markets. By distress I mean forced sales, foreclosures, short sales, and tax sales. As a result we have seen a lot of demand from investors on both the individual and institutional levels. The homeowners have been doing their small part of this as they are absorbing the properties in post distress state via equity sale. However a large portion of this distress has just been pulled off the market in the form of rentals. (Invitation homes, Homes 4 rent, Blackstone, Colony)

In those last 4 to 5 years I have been on the forefront of buying up those distressed properties and been in a unique position to watch the markets transform from the driver’s seat. But now in the last year or so I have seen a shift in the market. It has been a complex shift.

1st) is the amount of distress in the market has waned (less foreclosures).

2nd) is we have recovered a significant portion from the bottom. These range by area but some are 50-80% recovered and in fact some areas have new record values.

3rd) is because of 1 and 2 we are seeing less investor activity. (Not as many deals and not as good of a price, no need to invest)

 What I am seeing as a result of that is markets that were dependent on investors driving demand have cooled off, and as a result it’s left to the “regular” equity sales to sustain those levels.

The problem I’ve identified is that in markets that have been stimulated by investor demand for flips and rentals could be at risk for a pull-back in pricing because they don’t have the underlying fundamentals necessary to sustain that recovery. (The demand reduces, the supply increases and prices fall)

Does that mean the jig is up and we as investors need to just go home now? That really depends on what your expectations are on returns, what your long term goals are and where you are located.

To me the answer is no, but I am also more cognizant about about where I look to invest and at what margins I am willing to invest. As I prefer to be in and out of markets “flips” I look to markets that can sustain growth based on factors outside of investor demand. Which to me boils down to population.

Below I have attached a chart of the top 10 metro areas of over 1 million that have seen the largest percentage of growth from 2010-2013.

Firebird Investment Group 2014

Firebird Investment Group 2014

As you can see from the highlighted section, 4 out of the top 10 are in Texas. With over 1M new residents just in those 4 metro areas which is more than the top 6 California metro areas combined. My interpretation is that there is more demand just based on the simple population increase.

There are other factors I look at beyond just population growth. Like new housing starts, unemployment rates, affordability but this is one of the most crucial components to driving prices. More demand = higher prices.


God bless and looks like everything IS bigger in Texas,

-          Jake

Investor's take on the NAR Housing Data by Jake Harris

Investor’s Take on the NAR Housing Data

I often am out there talking to my compadres in the real estate investing world, as I find it helpful to not only look at reams of data but also talk to other people within my industry. I have also discovered over the years that very few investor types actually network with each other. Usually it is the old school mentality that they might steal my deal or idea or maybe because we have become so accustomed to beating each other up on properties that we have some underlying resentment towards each other. In my younger years my only reference was some old school developer types that were (probably still are) highly secret about anything they are doing. To put those fears aside I have found that in today’s technology day in age it is actually very difficult to get any proprietary deals, and people pretty much see everything if they wanted to look. I’m not saying that proprietary deals don’t exist but ironically enough they are usually sourced through your network. I have also found that as I network more I am exposed to new ideas or variations on my ideas. And I’m not talking the MLM (multi-level marketing) networking, I am talking about making genuine connections and building friendships and relationships.

Challenge: When was the last time you reached out to someone and had some coffee or lunch? Go do that, I promise you it will be more worthwhile than the cost of the lunch.  

Back to my point, my fellow investors don’t really need a NAR report to tell them what is going on in the market as they are living the data on a day to day basis and what we are seeing is the regression to the mean on these DOM and a slight pull back on pricing. Their sentiment is that the market in Sacramento and most of the West coast is much softer these days. Given the overall lack of distressed “good” deals and buyers being even more picky than usual. The buyers that watched Blackstone (Invitation Homes) come in and buy up several thousand homes for rentals helped stimulate a 15-20% market appreciation (Which is good if you own a house, bad if you are looking to buy one). Well those buyers feel like they have missed out on getting an affordable house. As a result the prices are much higher and rates are slightly higher (4.19% 30 year fixed currently) so they are holding out and looking for that perfect house and some are actually being unrealistic but there is nothing in the market to externally motivate them.

My take on the market is we are seeing a lot less distress in the market. The investors, me included have been picking the low hanging fruit “Deals” for several years now. With the lack of low hanging fruit the competition has been forced to do 4 things.

     1) Move to areas with more deals/less competition

     2) Accept lower and lower returns

     3) Find a new niche or value add component (additions, new builds, commercial)

     4) Close up shop and move on (take their ball and go home)

The fact that we are seeing less distressed properties being sold. The bidding wars coming to an end, plus the DOM are on the rise this business gets less and less profitable by the day. I have been seeing many of my competitors do some variation of all 4 of those options. 

DOM (Days on Market)

I’ve mentioned it a few times in a couple of blogs. But, why do the DOM matter that much? As an investor it’s almost just as beneficial to sell a property quickly as it is to sell it for maximized price. The reason for this is a lot of investors are looking at the annualized rate of return.


Scenario 1)  If I invest in a house for 100k and sell it for 120k in 3 months my profit is 20k and my annualized return is 80% (20% x 4)

Scenario 2) If I Invest in that same house for 100k and sell it for 130k in 6 months my profit is 30k but annualized return drops to 60%. (30% x 2)


Which of those would scenarios you rather?

Well to me both are good options but it really depends on the underlying objectives and market conditions. If you have 5 million dollars and you can only buy 2 million worth of good deals because of lack of inventory. Then I would lean towards the maximize profits because you can’t source enough deals (spend all your money). If the market has a ton of deals that fit your pricing matrix then you go for lower return but higher volume as the velocity of that money is much higher at 4x vs 2x.

What usually happens is a combination of those two, you can source a certain amount of deals in this environment and you are typically holding back a little just in case that home run deal comes along. But given the opportunity to make a quick exit you will usually take it .  Now the flip side of that is the hold times start creeping up there the investor mentality is to cut bait given a 6+ month hold time. They feel like they are chasing a bad return and would almost rather cut the pricing to break even and just be done with it in hopes their next deal is better than that one.

Less properties = Less competition

Now that we are seeing less distressed properties what does that mean for the future. My take on it is that it is a good thing. The bigger funds with massive overhead have to move on to greener pastures or get bogged down chasing too few deals. The midsize funds battle it out and lean up, doing more with less and take some hits on a few properties as the market adjust to an environment where the buyers rule to roost. This will drive some of the other midsize funds to move on as well. The mom and pops in general will take the biggest hit as they typically will have all their money in 1 or 2 deals and if they take losses on those then they will quickly exit the market.

There is still levels of distress coming down the pipeline but the banks have gotten better at how they dispose of it and with levels of competition lower there will be some opportunity for a patient but well-funded investors. As the vacuum of the competition leaving the markets will allow for some deals to slip through the cracks.

But and this is a big but, since that low hanging fruit is gone all of the investments should be based on solid fundamentals not speculation of the market. I’ll go more into the fundamentals in the future.

God Bless and go network with someone

Jake

Existing Homes sales slow 1.8% in August: Why it’s not as big of a deal as the media is making it to be. by Jake Harris


If you read any of the major news websites (msn, fox, yahoo) you will certainly see that the stock market has seen a decent dip today based on the home sales data released from the National Association of Realtors (NAR) for August.

The report shows a decrease in existing sales of 1.8% for the month. Although the media likes to sensational any tidbit of information to get people to click on their stories. The slowdown is somewhat expected. Let me tell you why.

If you look at a normal sales cycle of existing homes throughout the year the selling season is typically thought of to start the weekend after the Super bowl and winding down on Labor Day (Feb through Aug). It has an upswing starting in spring peaking in the start of the summer and then winds down to finish out the year on a slide. As you can see in the charts below:

If we take a more macro view of the housing market, say in the last 10 years. We have been in an atypical real estate market for almost the entire time. So making an assumptions based on any of this data is somewhat flawed because it doesn’t have enough consistent samples, especially making bold headline worthy statements from a month to month change in the sales volume.

What I mean by an atypical market is: that is in 2004 through 2007 we had a frenzy of activity and run up on pricing and volume of sales which was stimulated by sub-prime borrowing (free money). We then had the bubble bursting crash resulting in a drastic cliff like fall off in volume and pricing in 2007 and 2008. In 2009 we went to a dead nothing happening market (housing had flat lined). To 2010 and 2011 activity was sporadic in volume and in specific areas, given that the sales were mostly driven by early investors looking to buy assets at well below market pricing. Finally by 2012 we started to get back to a little bit of a normal cycle, as lending standards had loosened, and buyers felt like the housing had stabilized plus we had people that went through foreclosure now re-entering the market. But really 2013 and now 2014 are more of what would be considered something of a normal sale cycle.

Days on Market (DOM)

In addition to getting back to what a normal sale cycle looks like we have also seen more traditionally normal market times. If we look at DOM in the post housing bubble time of 2010-2012 we saw the inventory vastly distressed and at substantial discounts. Especially in areas hit hardest by foreclosures (CA , NV and AZ). Which resulted in mostly investor’s and cash buyers gobbling up inventory at insane rates. At one point we had less than a month inventory on the market in parts of California. This led to bidding wars and almost non-existent DOM times. Now that we are in these more normal sell cycles of 2013 and 2014 we are seeing a regression to the mean on DOM times. Which is ranging between 30-60 days before a house will go into contract.

All of these trends are actually normal in variety and by no means headline worthy. However I don’t think that is going to stop anymore from writing about them like they might be.

The one thing to note about the data was the continued decrease in distressed sales (Foreclosures, Short Sales). As well as a continued increase of equity sales (Homeowners). This shows signs that more investors are existing the market as the majority of the low hanging fruit has been picked and the homeowners are starting to pick up the slack as the prices have increased to relieve some of the homeowners that were upside down.

God Bless

- Jake

RECORD HIGHS FOR DOW, S&P 500 AND IPO (BABA). Where do I invest my money now? by Jake Harris

I went to a dinner the other night put on by Up Capital Management with Thomas Rowley from Invesco as the keynote speaker. There were talks of emerging markets, baby boomers, how to fix social security and the market run up we have been experiencing.

We are in a crazy time if you ask me. With the DOW, S&P 500 at all-time highs and the record setting IPO of Alibaba (BABA) primed to hit the market. The FED announcing that it will continue its (ZIRP) zero interest rate policy for the “considerable time” as it winds down its bond buying QE program in October and gold making its seasonal bearish dive. As I am writing this I am watching BABA open at 93 now 94. Nearly a 35-40% jump out of the gate.

We have seen a 200% run up on the S&P 500 since 2009 with zero corrections. Anton Bayer of Up Capital said they have their finger hovering over the sell button. Which seems like the smartest response to this insane run up. Ride the wave while you can and then hop off as soon as it starts to correct.

The question is raised where do you put your money if we see a market correction or where do you invest if you missed out on the phenomenal market run up?

Eric Savell also of Up Capital has some solid suggestions of energy companies, which to me also makes sense given the shifting emphasis on being energy independent here in the US. But being a real estate guy I would consider real estate as an alternative investment to the stock market. I can’t seem to pull the trigger on investing into something at the record setting peaks and the looming possibility of a 40% market correction.

If you invested in real estate in 2006 or 2007 odds are even if you picked a great asset and bought it under value and locked it up with extremely low rates you still saw it lose a ton of value. Now if you rode out that cliff and happened to be in areas like San Francisco or Orange County then you might be back to even 7 to 8 years later. So to me that is why I have a hard time investing in the stock market at its peak high. Yes a company may be primed for growth be and a solid investment like Alibaba (BABA) but it could also be a victim to the overall market correction. To be honest that is outside of my wheelhouse, as I am not a stocks and bonds guy. I have taken some of those finance classes in college and have a general knowledge of them but what I have really studied for the last 15 years is real estate. So how I view the world is through the lens of what does this mean for real estate. 

Besides just being biased towards real estate because I run a private equity fund that invest in real estate. I look into the deeper reasoning behind the scenes, the reasons why or why not invest into real estate if it is primed to be a safe and solid investment or not. This brings me back to the baby boomers, it has been wildly publicized about the baby boomers and how they are this huge market force. What has gone somewhat under the radar is that baby boomers are no longer the largest cohort group of people. Wait!? What!? When did that happen? Well in 2013 the 20 to 24 year old group ascended to the top of the list as the largest 5 year group of people and not only that, the baby boomers will continue to slide down the chart as we hit 2020.


What does this chart mean to real estate? What analysis can we correlate to these groups of people?

Well I will tell you since a large portion of my time is spent looking at deals and studying the data and economics as it relates to real estate. Plus if you saw my last post on CalPERS making a huge bet into real estate you would notice that nearly 2 billion of that committed capital was earmarked for multi-family residential (MFR) development and acquisitions.

Multi-family vacancies are at a national average of 4.2% with California markets at around 2.6-3% vacancy. This seems to be skewed way below other real estate classes with industrial vacancy at 8.2% and office vacancy at 15.1%.


Why would multi-family residential (MFR) vacancies be so low? Well it goes back to these population groups. If you are 20 to 24 typically you aren’t in a place to buy a house. Maybe you are fresh out of college and have a nice fat student loan debt to pay back (I’ll address student debt in a future blog for sure). But typically a 20 to 24 year old is more in a place to rent an apartment. Now add in the fact that the baby boomers are still a big group of the population as their population bandwidth is sizable. But we are seeing more and more baby boomers winding down their expenditures. As owning a house can be burdensome with upkeep and maintenance. Plus tell me who really wants to mow the lawn, or shovel snow? So they too are looking at multi-family residential as an option to simplify their life and reduce expenditures.

So to me this all correlates to the current trend of why the MFR market is red hot and will continue to be strong. Currently we see a pretty substantial increase in new multi-family projects breaking ground, but for the next several years I don’t see the high demand for multi-family being met. For a myriad of reasons as many of these projects were in the works years ago and just sidelined waiting for the market to come back. Now add into the fact that any new projects are very difficult to get off the drawing board to reality. Especially in California with issues of construction defect attorney’s breathing down your neck the moment you break ground and insurance companies refusing to insure multi-family builders. On top of city officials still on the crazy train with fees and lack of approvals. All of that adds up to a strong multi-family market with low vacancies for the foreseeable future. And why CalPERS committed 2 billion to multi-family in July.  

But the caveat of that population data is the real story to me, and lends itself to some other underlying factors of a positive future for the real estate market.

Let's bring that chart up again and I'll clue you into what I am seeing.


Look at what happens in 2020 with the population. We have the 25 to 39 age groups as the 1st, 2nd and 3rd place groups of people and coming in 4th is the Under 5 group. That to me means there is going to be lots of new babies. Plus if you look at the normal expenditures in your lifetime they really start to ramp up at the age of 25 and peak between 30 and 45 and then start to taper off as you get into later stages of your career.

Well in 2020 (which by the way is pretty much just 5 years away) with more babies and now the largest 3 groups of people in their prime spending years. I see an increase of demand for SFR housing. It is nice to be in an apartment when you are 20 to 24 with your buddies but it’s a different story when you are 25 to 39 and are married and have kids.

Some might argue that this group of people doesn’t want the burden of owning a home or can’t afford it. For some of them I would agree, but there will also be a large portion of those groups that want to own homes. But we could also talk about the fact that as we make more money having an interest payment that we can write off and depreciate against is a very nice bonus. As we all know the tax burden doesn’t look like it will be decreasing anytime in the near future.

For those that don’t want to own I think there will be options as SFR rentals has started to show it has some legs to make itself a solid investment alternative to multi-family as it offers the enjoy ability of a house but without the maintenance burden or the risk of loss of value but also without the appreciation gains. Even though these people don’t want to own houses it doesn’t reduce the demand for housing. It just changes who owns the house.

The future of interest rates are unpredictable with Janet Yellen and the Fed holding true to the low interest rates I see affordability will remain for the time being, but if we see a spike in rates that could hurt the affordability of housing however I don’t see it reducing the demand for housing as in the next 5 years we will have the top 4 groups of people all in a position to want to be in SFR vs MFR. I just see the ownership of some of those houses becoming more institutional and people transitioning from multi-family with record low vacancies into SFR rentals or buying a SFR.

How do we make money on these analysis is we look at markets that are still under-valued and allow us to move into distressed assets ahead of that growth then add value and be primed to exit. Some might say an announcement of the location of a new 5 billion dollar factory would be a good place to be investing. ;)

God Bless and have a great weekend.

Jake

CalPERS makes big 6.6B real estate bet by Jake Harris

CalPERS 6.7B Real Estate Bet in July

CalPERS makes big bet on real estate. It was announced today that in July the 300 billion dollar pension fund the largest in the US will not only be divesting its entire 4 billion hedge fund allocation but it has also committed 6.67 billion to real estate in the month of July. In one month this represents more than CalPERS has invested in real estate in the last 2 years combined.

Who and what did they invest in? They did a good job of spreading the investments across all regions and all asset classes.

- The largest single allocation was a co-investment joint venture of 1.3 billion to Institutional Multifamily Partners with GID Investment Funds for acquisitions and development of multi-family.

- Little over 1 billion was earmarked for Institutional Mall Investors and targeting dominate regional and superregional shopping centers.

- 985 million was co-invested with First Washington Realty a Bethesda Maryland based real estate investment group focusing on neighborhood shopping centers.

- 933 million was committed to large scale office and mixed use properties through Los Angeles based CommonWealth Partners by way of Fifth Street Properties (FSP).

- 412 million went to Institutional Core Multifamily Investors, a partnership with Invesco Real Estate targeting multi-family in the west and mid-west regions.

- GI Partners of Menlo park received $823 million for two existing joint ventures, TechCore and CalEast Solstice which focuses on technology related industrial properties.

- A follow-on commitment of 600 million with Institutional Logistics Partners, a partnership with Bentall Kennedy with a focus on dominate industrial properties.

- Rounding out the larger investments was a 200 million commitment to Pacific Multifamily Investors, a joint venture with Palo Alto, California based Pacific Urban Residential which will target class B multi-family properties.

So the breakdown is a little over 2 billion to retail via malls and shopping centers, just under 2 billion to multi-family and 1.4 billion to industrial properties and a 900 million investment to office and mixed use properties plus a handful of other under 100 million dollar commitments

All in all this is in-line with what I am predicting as we will see more capital being allocated towards real estate for the remainder of this year and beginning of the next year. As investors and funds will look to be in some more secure positions with a basis in solid assets to hedge against an inflation risk. Plus with the stock market at or near record highs in both the Dow and S&P 500 it would be a good time to take some profits off the table.

God Bless and Profitable Investing,

Jake

Sacramento Sales YTD by Jake Harris


Numbers:

Some of you out there are like me and spend a lot of time looking at the numbers. I have updated some of the raw sales data for July and gives us a look at the first half of the year. As predictable we have seen a steady growth of both the amount of sales and volume. This is a pretty standard sale cycle as we peak midway through the year and then start to see a steady decline as school starts back up and the holiday season creeps up on us.

Resale Market:

We will see how the rest of this year pans out, we have seen the DOM rise heavily in the rural areas as well on housing over the 500k price point. I have seen a resurgence in activity on areas with older established neighborhoods that are on the lower end of each area. Such as old Rocklin where the prices are high 200s to low 300s. South Natomas areas, and the areas surrounding historic Folsom. This makes sense as the prices have gone up, entry level buyers are looking for places they can still afford.

New Homes:

Even though new homes have seen an increase in activity we are still far off where traditionally we would be in a normal market. Tim Lewis has had a steady pace on his Crowne point subdivision off Sierra College and I80 as Bass Pro Shops has recently broken ground. K Hovnanian is in full swing of building out the once stalled Paseo Del Norte off Pleasant Grove in Roseville.

Projections:

For the rest of the year I predict a tapering off on both the volume of sales and number of sales as mentioned before with school starting and the holidays fast approaching. Interest rates should stay down for the remainder of the year. But be aware by middle of next year we could see the Fed start raising rates. Also the mid term elections could play a small role in the upcoming market just as lenders and buyers do tend to sit on the sidelines during election time.


If you want a full excel spreadsheet of the numbers feel free to send us an email and we can get a copy off to you.


God Bless and Happy Investing.

Jake Harris